Net Asset Value (NAV) is a key metric for evaluating publicly traded companies that hold Bitcoin. It reflects the market value of a company's Bitcoin holdings, offering insight into how those holdings align with stock valuations. Unlike traditional NAV calculations, Bitcoin NAV focuses solely on Bitcoin reserves and adjusts in real-time to reflect Bitcoin's 24/7 trading cycle. This makes it a practical tool for assessing market sentiment and company performance.
Key Takeaways:
- Bitcoin NAV Formula: Total Bitcoins held × Current Bitcoin price.
- mNAV (Modified NAV): Adjusts Bitcoin NAV by including cash, debt, and share dilution.
- Why It Matters: A premium to mNAV shows market confidence; a discount may signal concerns like debt or governance issues.
- Example: As of January 25, 2026, MARA Holdings held 53,250 BTC, with a Bitcoin NAV of $4.919 billion based on Bitcoin's price of $92,368.
NAV helps investors understand whether a company's stock is trading at a premium or discount relative to its Bitcoin holdings, shaping decisions about capital allocation and shareholder value.
What is NAV for Bitcoin Treasury Companies?
NAV Definition for Bitcoin Treasury Companies
For Bitcoin treasury companies, NAV (Net Asset Value) is calculated by multiplying the total number of Bitcoins held by the company by the current market price of Bitcoin.
As of December 1, 2025, Strategy reported holding approximately 650,000 BTC - equivalent to about 3.1% of all Bitcoin that will ever exist - resulting in a Bitcoin NAV of $59 billion. This figure reflects the raw market value of their Bitcoin holdings based on the prevailing spot price.
A company SEC filing provides a more detailed explanation of this metric:
"Bitcoin NAV represents the total number of bitcoin the Company holds as of a specified date multiplied by the current market price of one bitcoin... It does not take into account or include the Company's indebtedness or the liquidation value of its perpetual preferred stock."
This definition highlights how Bitcoin NAV focuses solely on the market value of Bitcoin holdings, setting it apart from traditional NAV calculations.
How Bitcoin NAV Differs from Standard NAV
In traditional finance, NAV is commonly used by mutual funds and ETFs and is calculated as (Total Assets - Total Liabilities) ÷ Shares Outstanding. Bitcoin NAV, however, is much simpler - it only accounts for the market value of Bitcoin reserves, ignoring liabilities and other financial factors.
Traditional NAV serves as a pricing mechanism for share transactions, while Bitcoin NAV primarily provides a snapshot of a company’s Bitcoin holdings. It’s often used to gauge market sentiment and evaluate the effectiveness of a company’s treasury strategy.
One key distinction is that Bitcoin NAV can be updated in real time, reflecting Bitcoin's 24/7 trading cycle. This makes it a more dynamic metric compared to traditional NAV, which is typically updated quarterly under GAAP standards. This real-time aspect is particularly useful for capturing Bitcoin's frequent price fluctuations.
How to Calculate NAV for Bitcoin Treasury Companies
The Basic NAV Formula
Calculating Bitcoin NAV is pretty simple: you multiply the total number of Bitcoins a company holds by the current market price of Bitcoin. Here's the formula:
NAV = BTC Price × BTC Count.
For instance, if a company owns 10,000 BTC and Bitcoin is trading at $92,000, the Basic Bitcoin NAV would be $920 million.
Take MARA Holdings, Inc. as an example. On January 25, 2026, the company held 53,250 BTC. With Bitcoin priced at $92,368, its Basic Bitcoin NAV worked out to $4.919 billion. Since Bitcoin trades around the clock, this value changes continuously. To get a clearer financial picture, we then adjust this basic figure by factoring in cash reserves, debt, and potential dilution.
Calculating mNAV with Adjustments
Modified NAV (mNAV) offers a more detailed view by including cash reserves and accounting for debt obligations. Here's how you calculate it:
mNAV = (Bitcoin NAV + Cash - Total Debt) ÷ Fully Diluted Shares.
In this formula, the "fully diluted shares" include all outstanding shares, stock options, Restricted Stock Units (RSUs), and any shares from convertible notes that are currently "in the money".
Example: NAV and mNAV Calculation
Let’s break this down with real-world data. In July 2025, Strategy reported total assets of $64.77 billion and total liabilities of $14.4 billion. This gave them a NAV of roughly $50.37 billion. At the time, their market capitalization was around $95 billion, translating to a 1.79x premium over their NAV.
By November 30, 2025, Strategy’s financial structure had shifted. The company held 650,000 BTC, valued at $59 billion (Bitcoin NAV), had $1.44 billion in cash reserves, and carried $8.214 billion in debt along with $7.779 billion in preferred stock. They reported a Loan to Value (LTV) ratio of 11%, which is calculated by dividing net debt by the Bitcoin reserve.
When calculating per-share mNAV, it’s crucial to use the fully diluted share count. This ensures you're factoring in potential dilution, especially during Bitcoin price surges. Convertible instruments, which are common in Bitcoin treasury capital structures, make this step particularly important.
Why NAV Matters for Bitcoin Treasury Companies
NAV as a Treasury Strategy Indicator

NAV (Net Asset Value) serves as a straightforward way to assess a company's Bitcoin holdings and their current market value. It's a clear measure of whether a treasury strategy is delivering results. By reporting Bitcoin reserves, NAV simplifies complex financial data and offers a snapshot of the treasury's worth. This snapshot becomes even more insightful when enhanced by modified NAV (mNAV) metrics.
Modified NAV (mNAV) goes a step further by incorporating factors like cash, debt, and share dilution. It acts as a key benchmark for evaluating how effectively a company converts capital into Bitcoin reserves. Companies are now using metrics such as "Satoshis Per Share" (SPS) and "Bitcoin Yield" - which tracks the percentage change in SPS over time - to measure the growth of indirect Bitcoin ownership.
For example, in December 2025, American Bitcoin Corp. (Nasdaq: ABTC) joined the ranks of the top 20 public Bitcoin treasuries with around 5,098 BTC. Co-Founder Eric Trump introduced "Satoshis Per Share" and "Bitcoin Yield" as central metrics, giving investors a clearer picture of their indirect Bitcoin ownership through the company’s equity.
How NAV Affects Investor Confidence
Beyond measuring strategy, NAV plays a direct role in shaping investor confidence. When a company trades at a premium to mNAV (a ratio above 1.0), it signals strong market belief in the management's ability to grow Bitcoin-per-share through smart financial moves. This creates what’s known as an "accretive loop." Companies trading at a premium can issue new equity to purchase more Bitcoin, which increases Bitcoin-per-share for existing shareholders.
A prime example of this in action occurred between January 12 and January 20, 2026, when Strategy acquired an additional 22,305 BTC for $2.125 billion. This brought their total holdings to 709,715 BTC. This active management of the accretive loop has been a major factor in their valuation relative to their Bitcoin reserves. By January 23, 2026, public companies collectively held 1,080,504 BTC, valued at approximately $96.34 billion.
"A premium is a vote of confidence. It suggests investors believe the company will generate accretion, mitigate risk, and create utility." – Conor Mulcahy, Bitcoin Magazine
On the flip side, a discount to mNAV often raises concerns. It might indicate excessive debt, poor governance, high fees, or fears of forced Bitcoin sales. For instance, in late 2025, mNAV ratios varied widely: Metaplanet Inc. traded at a 1.67 premium, while Strategy (MSTR) was at 0.88 (Basic) and Twenty One Capital at 0.80.
NAV Limitations
While NAV provides valuable insights, it has its blind spots. It typically assigns no value to a company's actual operating business - whether that's software development, mining operations, or other revenue-generating activities. This means if a company has profitable ventures outside of Bitcoin holdings, NAV overlooks that entirely.
"mNAV is 'woefully deficient' for failing to reflect key balance sheet risks - especially assumptions about convertible notes." – Greg Cipolaro, Global Head of Research, NYDIG
Additionally, NAV doesn’t account for refinancing risks. For example, convertible notes might require cash repayment if certain market conditions aren’t met, instead of converting to shares. Unlike Bitcoin ETFs, which use arbitrage to keep share prices aligned with NAV, operating companies’ stock prices are driven by sentiment. This often leads to persistent premiums or discounts in their valuation.
sbb-itb-f81ab9b
Bitcoin Treasury mNAV Explained by MSTR CEO Phong Le
How to Use NAV Metrics to Evaluate Bitcoin Treasury Companies
Bitcoin Treasury Company NAV Metrics Comparison - January 2026
Monitoring NAV and mNAV Over Time
Since Bitcoin trades around the clock, traditional GAAP reports can become outdated almost instantly. To stay accurate, CFOs and investors need to focus on real-time mNAV (market Net Asset Value) to reflect a company's current Bitcoin value at any given moment.
It's important to monitor multiple mNAV variations at the same time. mNAV Basic (market cap divided by Bitcoin value) provides a quick snapshot of market sentiment. mNAV Diluted adjusts for factors like options, restricted stock units, and convertible notes, offering a clearer picture of "Bitcoin-per-share" after potential dilution. mNAV EV (Enterprise Value) goes further, factoring in debt and cash to give a full view of the company's capital structure.
Another key metric to track is Bitcoin Yield, which measures the percentage change in Bitcoin-per-diluted-share over time. For instance, in July 2025, Strategy reported a 25% Bitcoin Yield year-to-date, showcasing how effectively they used the capital markets to increase their Bitcoin holdings without excessive shareholder dilution. Companies like Metaplanet have taken transparency to the next level by providing live dashboards with on-chain proof of reserves, enabling investors to verify holdings in real-time.
Additionally, always verify the fully diluted share count, including warrants and convertible notes that are in the money. This helps avoid overestimating Bitcoin-per-share value and highlights potential dilution risks.
Next, let’s explore how mNAV ratios act as benchmarks that influence market perceptions.
Understanding NAV Benchmarks
The mNAV ratio is a powerful indicator of market expectations. A ratio above 1.0 suggests the market values the company at a premium to its Bitcoin holdings, reflecting confidence in management’s ability to grow Bitcoin-per-share through smart capital decisions. On the other hand, a ratio at or below 1.0 signals a discount, often due to concerns about governance, leverage, or management fees.
"Once you are trading at NAV, shareholder dilution is no longer strategic. It's extractive." – Matthew Sigel, Head of Digital Assets Research, VanEck
Strategy formalized this concept in July 2025 by setting clear mNAV thresholds for capital raises. They avoid issuing equity below 2.5x mNAV, issue selectively between 2.5x and 4.0x, and actively issue above 4.0x. This disciplined approach allowed them to raise over $10 billion during Q2 2025 while maintaining a 25% year-to-date increase in Bitcoin-per-share.
When evaluating mNAV, it’s also essential to consider whether the metric accounts for the company’s operating business value. A low mNAV might indicate the market assigns little or even negative value to the operating business. Additionally, assess refinancing risks - if convertible notes need to be repaid in cash instead of being converted to equity, a low mNAV can put significant financial strain on the company.
These benchmarks come to life when examining real-world examples.
Real-World NAV Examples
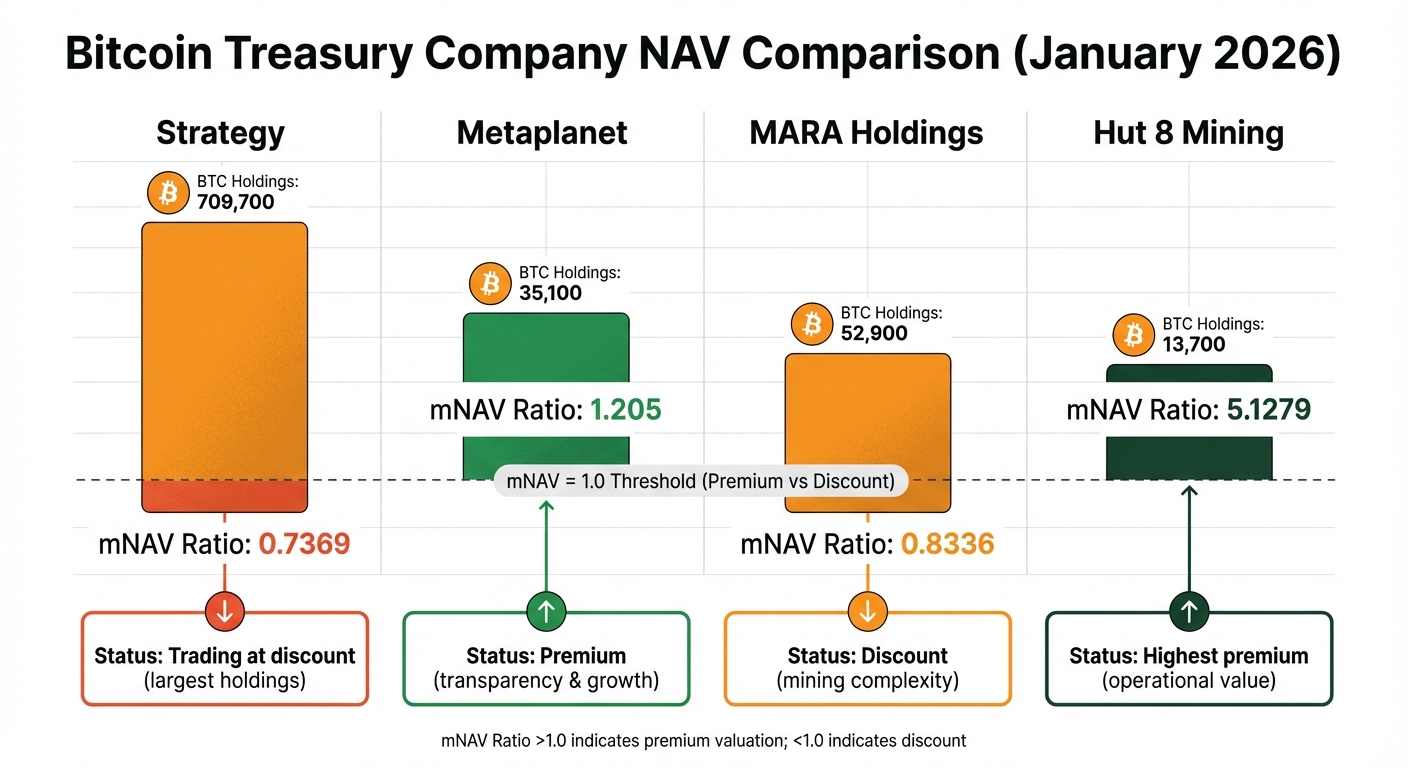
Real-world data illustrates how mNAV benchmarks shape treasury strategies and investor perceptions. Here’s a snapshot of the Bitcoin treasury landscape as of January 2026:
| Company | BTC Holdings | mNAV Ratio | Valuation Signal |
|---|---|---|---|
| Strategy | 709,700 | 0.7369 | Trading at a discount despite having the largest holdings |
| Metaplanet | 35,100 | 1.205 | Premium reflects transparency and growth strategy |
| MARA Holdings | 52,900 | 0.8336 | Discount suggests mining operations add complexity |
| Hut 8 Mining | 13,700 | 5.1279 | Highest premium indicates strong operational value |
Metaplanet’s experience highlights the impact of transparency on valuation. In June 2025, the Japanese company traded at a 384% premium to its Bitcoin NAV - the highest among major peers. This was largely due to their live dashboard, which displayed real-time BTC holdings, Bitcoin-per-share metrics, and on-chain proof of reserves. Their commitment to transparency showed that even smaller treasury operations could command significant premiums.
Meanwhile, Strategy demonstrated how disciplined capital raises can enhance shareholder value. In December 2025, they completed an 8.5-day capital raise, selling equity at an average mNAV of 1.17x. This effort raised $1.44 billion and generated a USD gain of $207 million over the raw Bitcoin value, increasing Bitcoin-per-share for existing holders while expanding total holdings.
The adoption of fair-value accounting under ASU 2023-08, effective after December 15, 2024, has also improved NAV reliability. For example, Strategy’s Q2 2025 results included a $14.0 billion unrealized digital asset gain, offering a more accurate view of treasury value compared to the older cost impairment model.
Conclusion
NAV has become a key decision-making tool for Bitcoin treasury companies, serving as a guide for CFOs and financial leaders. Metrics like mNAV reveal real-time market sentiment, highlight capital opportunities, and measure balance sheet health. When mNAV exceeds 1.0, it reflects investor confidence, creating opportunities for raising capital without significant dilution. Conversely, when it falls below 1.0, companies often turn to strategies like share buybacks or operational adjustments to regain footing.
The rise of Bitcoin treasury strategies marks a shift in corporate finance. Traditional GAAP book value no longer fully represents the dynamics of 24/7 digital asset markets. Instead, mNAV variants - such as Basic, Diluted, and EV - offer the clarity investors need to evaluate per-share exposure and refinancing risks. These modern NAV metrics seamlessly connect valuation, strategy, and market behavior, providing a clearer picture of financial performance.
"The next game probably is not about buying Bitcoin... It is about building the financial architecture to keep mNAV above one, cycle after cycle." – CoinDesk
NAV is fundamentally about strategic decision-making. Companies trading at a premium can raise capital efficiently, while those trading at a discount must rethink their approach. A prime example came in late 2025, when Strategy raised $1.44 billion at an average mNAV of 1.17x, securing a $207 million "USD Gain" beyond the raw Bitcoin value.
As Bitcoin treasury strategies continue to evolve, NAV metrics remain central to assessing performance and shaping financial strategies. For financial leaders, understanding these metrics is about more than just tracking current performance - it’s about positioning for long-term growth in an ever-changing global financial landscape.
FAQs
What is Bitcoin NAV, and how does it affect investor confidence in treasury companies?
Bitcoin NAV, or Net Asset Value, reflects the total value of a company's Bitcoin holdings divided by its outstanding shares. This metric plays a crucial role in assessing the financial position and transparency of public companies that hold Bitcoin as part of their treasury strategy.
When a company's NAV accurately mirrors the value of its Bitcoin assets, it provides investors with a clear and dependable indicator of the company's underlying worth. On the other hand, if the market price of a company's stock significantly diverges from its NAV - whether trading above (a premium) or below (a discount) - it can spark concerns about how the market perceives the company and whether its valuation is accurate. This gap between stock price and NAV can influence investor confidence in the company's financial health and growth outlook.
A well-reported and transparent NAV is especially valuable in the unpredictable cryptocurrency market, where clarity is often scarce. Companies that prioritize accurate NAV reporting are generally viewed as more reliable, which can enhance investor trust and contribute to their long-term success.
What’s the difference between NAV and mNAV when analyzing Bitcoin treasury companies?
When analyzing Bitcoin treasury companies, two metrics often come into play: NAV (Net Asset Value) and mNAV (Market to Bitcoin NAV). While both are essential, they serve distinct purposes.
NAV is a straightforward calculation that represents the per-share value of a company's assets minus its liabilities. This includes the company's Bitcoin holdings, giving investors a snapshot of its underlying worth. Think of it as the company's "intrinsic value."
mNAV, on the other hand, takes a broader perspective. It compares the company's enterprise value (essentially how the market values the entire business) to its Bitcoin NAV. This metric sheds light on how the market perceives the company relative to its Bitcoin assets.
Here’s how they differ in practice:
- If mNAV is above 1.0, the market is valuing the company higher than its Bitcoin NAV. This could be due to factors like strong branding, strategic advantages, or other non-Bitcoin assets that investors find appealing.
- If mNAV is below 1.0, the company might be trading at a discount. This could signal market concerns, undervaluation, or skepticism about its future performance.
Together, these metrics provide a well-rounded view. NAV acts as a baseline for a company's asset backing, while mNAV offers insight into market sentiment and valuation dynamics. Both are crucial for evaluating a company's financial health and how it’s perceived in the market.
Why is tracking real-time Bitcoin NAV crucial for understanding market trends?
Real-time Bitcoin NAV (Net Asset Value) plays a crucial role in offering an updated snapshot of the value of a company's Bitcoin holdings. This metric serves as a vital tool for investors and financial professionals to understand how the market views a company's exposure to Bitcoin's price changes.
Keeping an eye on real-time NAV allows for a clearer picture of market sentiment, a company’s financial standing, and its overall position within the market landscape. It’s especially important for industries where Bitcoin price movements have a significant impact on valuation and investor confidence.